I’m new to ScadaBR : Couldn’t get ScadaLTS to run on my RaspberryPi, but ScadaBR works great.
I could use some help/direction with an issue though :
I’m trying to create a Graphical View using a dynamic gauge with a fast update rate. The process that I am monitoring is capable of providing updates at 50ms interval, but I have set the update period of the Data Source to 100ms.
The graphical view only seems to update about once per second, no matter what the Data Source Update period is set to.
Is there any way to increase the update frequency of the Graphical View to get 5-10 updates per second?
Any help would be much appreciated. Thanks in advance!
You can change the update period, but this is not a setting that is currently available in the ScadaBR interface.
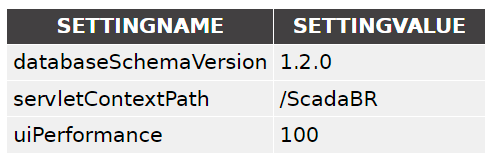
What you need to do is change, in the database, the “SystemSettings” table. Find the row whose value of SETTINGNAME matches uiPerformance. On this line, change the value of SETTINGVALUE to the time in milliseconds you want.
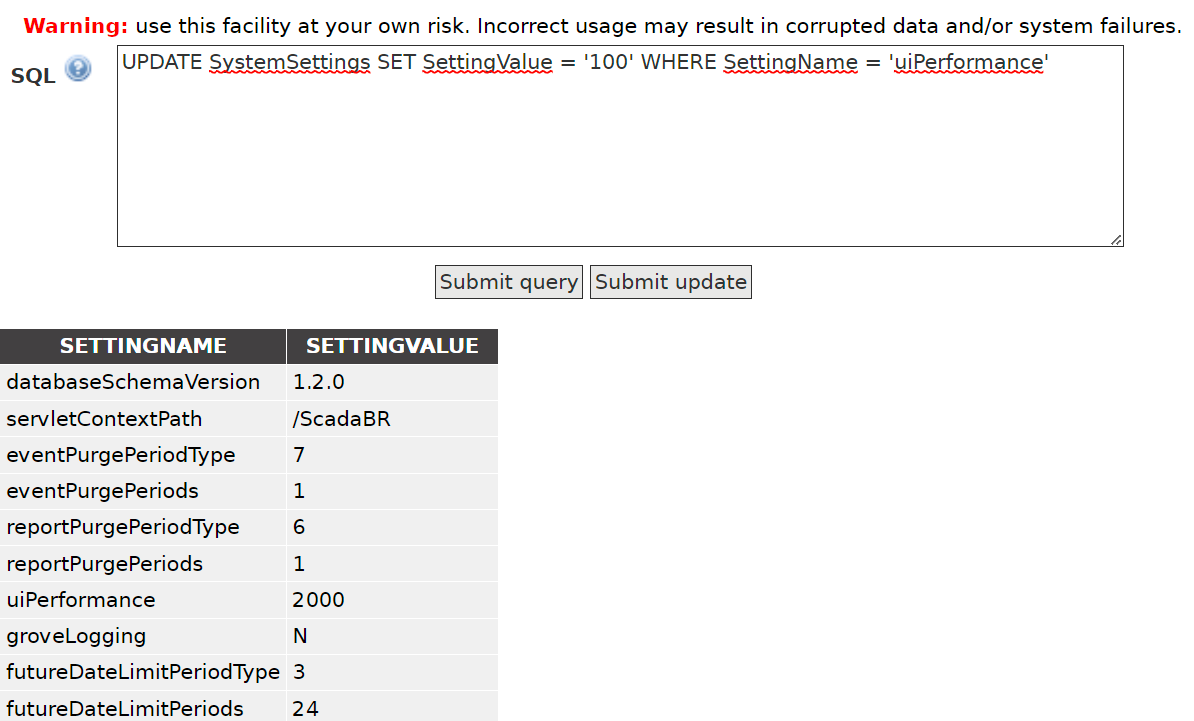
Using ScadaBR’s SQL page, you can do this by sending this update to the DB (change 500 to the desired value in milliseconds):
UPDATE SystemSettings SET SettingValue = '500' WHERE SettingName = 'uiPerformance'
Additionally, you must edit the Javascript file in /opt/ScadaBR/tomcat/webapps/ScadaBR/resources/common.js.
Inside the mango.longPoll.pollCB function, remove this snippet:
if (mango.longPoll.lastPoll) {
     var duration = new Date().getTime() - mango.longPoll.lastPoll;
     if (duration < 300) {
         // The response happened too quick. This may indicate a problem,
         // so just wait a bit before polling again.
         setTimeout(mango.longPoll.poll, 1000);
         return;
     }
}