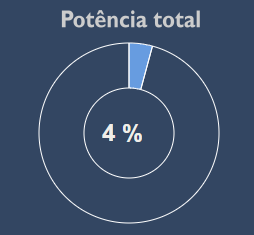
1. Gráfico donut
Eu gosto de usar esse tipo de gráfico para apresentar dados que possuem valores máximos e mínimos bem definidos (potência ativa de usina solar, por exemplo).

Código-exemplo:
//Utilizar a variável do sistema POTENCIA kW TOTAL
var valor = value;
if (valor < 0) {valor = 0;}

//Colocar qual o valor máximo da variável
var valor_max = 9*100;
var complemento = valor_max - valor;
if (complemento < 0) {complemento = 0;}

//------Ajustes do gráfico

//CORES
var graph_color = "#1879ad";
var hover_graph_color = "#1879ad";
var bg_color = "#0c121c";

//DIMENSOES
var altura = "175";
var largura = altura;
var furo_donut = "45%";

//LABELS
var id_chart = 	"donut_chart";
var label_grafico = "Potência Ativa [kW]";


//------Script para o servidor
var s = "";

//CANVAS
s += "<canvas id='" + id_chart + "' width='" + largura + "' height='" + altura + "'></canvas>";

//CONFIGURAÇAO SCRIPT PARA GERAR O GRAFICO
s += "<script>";
s += "    var data = {";
//s += "        labels: ['" + label_grafico + "'],";
s += "        datasets: [{";
s += "            data: [" + valor + "," + complemento + "], ";
s += "            backgroundColor: ['"+ graph_color +"', '" + bg_color + "'], ";
s += "            hoverBackgroundColor: ['"+ hover_graph_color +"', '" + bg_color + "']";
s += "        }]";
s += "    };";

s += "    var options = {";
s += "        cutout: '" + furo_donut + "', "; //Tamanho do furo do meio do gráfico
s += "        responsive: true,";
s += "        maintainAspectRatio: false,";
s += "        animation:{ animateRotate: false }";
s += "    };";

s += "    var ctx = document.getElementById('" + id_chart + "').getContext('2d');";
s += "    var myDonutChart = new Chart(ctx, {";
s += "        type: 'doughnut',";
s += "        data: data,";
s += "        options: options";
s += "    });";
s += "</script>";


return s;
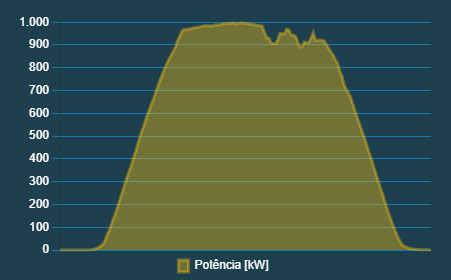
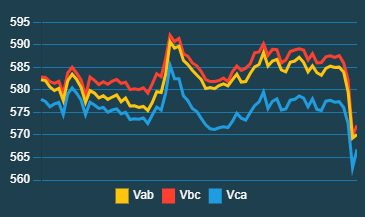
2. Gráfico de linha
Eu gosto de usar esse tipo de gráfico para apresentar dados ao longo do tempo (potência ativa, tensões, temperatura).


Código-exemplo:
//---------------------------------
// GRÁFICOS PARA SCADALTS 2.7.7.3
//---------------------------------

// Colocar o XID das variáveis
var reading_points = [ 'qgbt_Vab', 'qgbt_Vbc', 'qgbt_Vca'];

// Cores das variáveis (na ordem da variável reading_points)
var series_colors = [ '#ffc50e', '#ff4030', '#209de0' ];

// Nome de cada variável, como vai aparecer na legenda (seguir a mesma ordem dos anteriores)
var descriptions = [ 'Vab', 'Vbc', 'Vca' ];

//---------- CONFIGURAÇÕES DO GRÁFICO
//DIMENSOES
var altura = "250";
var largura = "400";

//LABELS
var id_chart = 	"chart_tensoes";

// EIXO Y COMEÇA NO ZERO?
var begin_Y_at_zero = false;

// HABILITAR ANIMAÇÃO DO GRÁFICO
var enable_animations = false;

// MOSTRAR VALORES NO EIXO X?
var mostrar_eixo_x = false;

// COR DO TEXTO EIXOS X E Y
var cor_texto = "white";

// COR DAS LINHAS DO GRID
var cor_grid = "#1879ad";

// PREENCHER O ESPAÇÔ ENTRE O GRÁFICO E O EIXO X?
var fill_chart = false;

// UNIDADE DE TEMPO DA CONSULTA DOS DADOS
//0 -> Seconds | 1 -> Minutes | 2 -> Hours
var time_unit = 2;

// INTERVALO DE TEMPO A SER CONSULTADO
var time_value = 2;


//--------------------------------------------------

// FUNÇÕES DE CONSULTA DE DADOS E MONTAGEM DOS DATASETS

var invalid_message = "is not a numeric, multistate or binary datapoint";
var invalid_html = "";

// Get datapoint identifiers (ID/XID)
function getDataPointIds(identifier) {
    var dpDAO = new com.serotonin.mango.db.dao.DataPointDao();
    var dp = dpDAO.getDataPoint(identifier);

    var point_id = dp.getId();
    var point_xid = String(dp.getXid());
    return { id: point_id, xid: point_xid };
}

// Get data point type
function getDataPointType(identifier) {
	var types = {
		0: "UNKNOWN",
		1: "BINARY",
		2: "MULTISTATE",
		3: "NUMERIC",
		4: "ALPHANUMERIC",
		5: "IMAGE"
	}

	var dpDAO = new com.serotonin.mango.db.dao.DataPointDao();
    var dp = dpDAO.getDataPoint(identifier);
	var locator = dp.getPointLocator();
	return types[locator.getDataTypeId()];
}

// Get data points' values and times
function readPoints(id) {
	// Units: Second, minute, hour
	var unit_values = [ 1000, 60000, 3600000];
	var index = (time_unit > 3) ? 0 : time_unit;
	var since = new Date().getTime() - (time_value * unit_values[index]);

	var val = new com.serotonin.mango.db.dao.PointValueDao();
	return val.getPointValues(id, since);
}

// Create a JSON array with a point value history
function createDataArray(obj, is_binary) {
	var x = "[";
    var y = "[";
	var size = obj.size()-1;

	for (var i = size; i >= 0; i--) {
		var time = obj.get(i).time;
        var data = new Date(time).toLocaleTimeString();

		var value = obj.get(i).value;
		if (is_binary){ value = String(value) == "true" ? 1 : 0; }

		x += "'" + String(data) + "'";
		y += parseFloat(value).toFixed(2);
		if (i != 0) {
			x += ",";
			y += ",";
		}
	}
	x += "]";
	y += "]";


    // Retorna um objeto com as subfunções eixoX e eixoY
    return {
        eixoX: function() {
            return x;
        },
        eixoY: function() {
            return y;
        }
    };
}

// Create a JSON object compatible with Chart.js "datasets"
function createJSONDatasets() {
	var size = reading_points.length;
	var foo = "[";

	for (var i = 0; i < size; i++) {
		var is_binary = false;
		var dp_id = getDataPointIds(reading_points[i]).id;
		var dp_type = getDataPointType(dp_id);
		var point_values = readPoints(dp_id);

		// Don't include non numeric datapoints in array
		if (dp_type == "BINARY") {
			is_binary = true;
		} else if (dp_type != "NUMERIC" && dp_type != "MULTISTATE") {
			invalid_html += descriptions[i] + ": " + invalid_message + "<br>";
			continue;
		}

		if (foo != "[")
			foo += ",";

		var reading_array = createDataArray(point_values, is_binary).eixoY();
		foo +=	"{";
		foo +=		"'label':'" + descriptions[i] + "',";
        foo +=		"'fill': " + fill_chart + ", pointRadius: 0,";
		foo +=		"'data':" + reading_array + ",";
		foo +=		"'backgroundColor':'" + series_colors[i] + "',";
		foo +=		"'borderColor':'" + series_colors[i] + "'";
		foo +=	"}";

	}

	foo += "]";
	return foo;
}

//------Script para o servidor
var s = "";

//CANVAS
s += "<canvas id='" + id_chart + "' width='" + largura + "' height='" + altura + "'></canvas>";

//CONFIGURAÇAO SCRIPT PARA GERAR O GRAFICO
s += "<script>";
s += "    var data = {";
s += "        labels: " + createDataArray(readPoints(getDataPointIds(reading_points[0]).id), false).eixoX() + ",";
s += "        datasets: " + createJSONDatasets();
s += "    };";

s += "    var options = {";
s += "        responsive: true,";
s += "        animation: "+ enable_animations +",";
s += "        plugins: { legend: { position: 'bottom', labels: { fontSize: 16, color: '"+cor_texto+"', boxWidth: 10 } } },";
s += "        scales: { ";
s += "                  x: {";
s += "                       display: " + mostrar_eixo_x + ",";
s += "                       ticks: { color: '"+ cor_texto +"' },";
s += "                       grid: { display: false, color: '" + cor_grid + "'}";
s += "                  },";
s += "                  y: {";
s += "                       beginAtZero: "+ begin_Y_at_zero +",";
s += "                       ticks: { color: '"+ cor_texto +"' },";
s += "                       grid: { display: true, color: '" + cor_grid + "'}";
s += "                  }";
s += "        }";
s += "    };";

s += "    var ctx = document.getElementById('" + id_chart + "').getContext('2d');";
s += "    var myLineChart = new Chart(ctx, {";
s += "        type: 'line',";
s += "        data: data,";
s += "        options: options";
s += "    });";
s += "</script>";
return s;

/* ---- DEBUG DAS FUNÇÕES
var eixoX   = createDataArray(readPoints(getDataPointIds(reading_points[0]).id), false).eixoX();
var Vab     = createDataArray(readPoints(getDataPointIds(reading_points[0]).id), false).eixoY();
var Vbc     = createDataArray(readPoints(getDataPointIds(reading_points[1]).id), false).eixoY();
var Vca     = createDataArray(readPoints(getDataPointIds(reading_points[2]).id), false).eixoY();

return eixoX + "<br>"+ Vab + "<br>"+ Vbc + "<br>"+ Vca + "<br>";
//*/
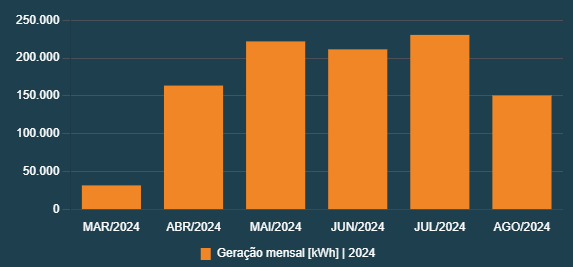
3. Gráfico de colunas
Eu gosto de usar esse tipo de gráfico para apresentar dados comparativos.

Código-exemplo:
// Colocar o XID das variáveis
var reading_points = [ 'usina_kwh_mes_grafico'];

// Cores das variáveis (na ordem da variável reading_points)
var series_colors = [ '#f18627' ];

//---------- CONFIGURAÇÕES DO GRÁFICO
//DIMENSOES
var altura = "240";
var largura = "550";

//LABELS
var id_chart = 	"chart_kwh_mes";

// EIXO Y COMEÇA NO ZERO?
var begin_Y_at_zero = true;

// HABILITAR ANIMAÇÃO DO GRÁFICO
var enable_animations = false;

// MOSTRAR VALORES NO EIXO X?
var mostrar_eixo_x = true;

// COR DO TEXTO EIXOS X E Y
var cor_texto = "white";

// COR DAS LINHAS DO GRID
var cor_grid = "#4a4f58";

// PREENCHER O ESPAÇÔ ENTRE O GRÁFICO E O EIXO X?
var fill_chart = true;

/*
// UNIDADE DE TEMPO DA CONSULTA DOS DADOS
//0 -> Seconds | 1 -> Minutes | 2 -> Hours
var time_unit = 2;

// INTERVALO DE TEMPO A SER CONSULTADO
var time_value = 12;
*/

//retorna o ts do dia 1 de janeiro do ano corrente
var ano = new Date().getFullYear();
var ts_since = obterTimestamps(ano);

// Nome de cada variável, como vai aparecer na legenda (seguir a mesma ordem dos anteriores)
var descriptions = "Ger. mês [kWh]";


//--------------------------------------------------

// FUNÇÕES DE CONSULTA DE DADOS E MONTAGEM DOS DATASETS

var invalid_message = "is not a numeric, multistate or binary datapoint";
var invalid_html = "";

// Get datapoint identifiers (ID/XID)
function getDataPointIds(identifier) {
    var dpDAO = new com.serotonin.mango.db.dao.DataPointDao();
    var dp = dpDAO.getDataPoint(identifier);

    var point_id = dp.getId();
    var point_xid = String(dp.getXid());
    return { id: point_id, xid: point_xid };
}

// Get data point type
function getDataPointType(identifier) {
	var types = {
		0: "UNKNOWN",
		1: "BINARY",
		2: "MULTISTATE",
		3: "NUMERIC",
		4: "ALPHANUMERIC",
		5: "IMAGE"
	}

	var dpDAO = new com.serotonin.mango.db.dao.DataPointDao();
    var dp = dpDAO.getDataPoint(identifier);
	var locator = dp.getPointLocator();
	return types[locator.getDataTypeId()];
}

// Get data points' values and times
function readPoints(id) {
	// Units: Second, minute, hour
	//var unit_values = [ 1000, 60000, 3600000];
	//var index = (time_unit > 3) ? 0 : time_unit;
	//var since = new Date().getTime() - (time_value * unit_values[index]);
	var since = new Date().getTime() - ts_since;

	var val = new com.serotonin.mango.db.dao.PointValueDao();
	return val.getPointValues(id, since);
}

// Create a JSON array with a point value history
function createDataArray(obj, is_binary) {
	var x = "[";
    var y = "[";
	var size = obj.size();

	for (var i = 0; i <= size; i++) {

		if (i != size) {
			var time = obj.get(i).time;
			var data = new Date(time);
			var mes = data.getMonth();
			var ano = data.getFullYear();
			var meses = ['JAN','FEV','MAR','ABR','MAI','JUN','JUL','AGO','SET','OUT','NOV','DEZ'];
			for(var j=0; j<meses.length; j++){
				if(j == mes){
					var mes_output = meses[j];
				}
			}
			var data_output = mes_output + "/" + ano;
			var value = obj.get(i).value;
			if (is_binary){ value = String(value) == "true" ? 1 : 0; }
			x += "'" + String(data_output) + "'";
			y += parseFloat(value).toFixed(2);
			x += ",";
            y += ",";
		}
		else{
			var data = new Date();
			var mes = data.getMonth();
			var ano = data.getFullYear();
			var meses = ['JAN','FEV','MAR','ABR','MAI','JUN','JUL','AGO','SET','OUT','NOV','DEZ'];
			for(var j=0; j<meses.length; j++){
				if(j == mes){
					var mes_output = meses[j];
				}
			}
			var data_output = mes_output + "/" + ano;
			var kwh_mes = new dataPointInfo('usina_kwh_mes').valorFacade();
			x += "'" + String(data_output) + "'";
			y += parseFloat(kwh_mes).toFixed(2);
		}
	}

	x += "]";
    y += "]";

    // Retorna um objeto com as subfunções eixoX e eixoY
    return {
        eixoX: function() {
            return x;
        },
        eixoY: function() {
            return y;
        }
    };
}

//------Script para o servidor
var s = "";

//CANVAS
s += "<canvas id='" + id_chart + "' width='" + largura + "' height='" + altura + "'></canvas>";

//CONFIGURAÇAO SCRIPT PARA GERAR O GRAFICO
s += "<script>";
s += "    var data = {";
s += "        labels: " + createDataArray(readPoints(getDataPointIds(reading_points[0]).id), false).eixoX() + ",";
s += "        datasets: [{";
s += "                      'fill': " + fill_chart + ",";
s += "                      'label': 'Geração mensal [kWh] | " + String(ano) +"',";
s += "                      'data': " + createDataArray(readPoints(getDataPointIds(reading_points[0]).id), false).eixoY() + ",";
s += "                      'backgroundColor':'" + series_colors + "',";
s += "                      'borderColor':'" + series_colors + "'";
s += "					}]";
s += "    };";

s += "    var options = {";
s += "        responsive: true,";
s += "        animation: "+ enable_animations +",";
s += "        plugins: { legend: { position: 'bottom', labels: { fontSize: 16, color: '"+cor_texto+"', boxWidth: 10 } } },";
s += "        scales: { ";
s += "                  x: {";
s += "                       display: " + mostrar_eixo_x + ",";
s += "                       ticks: { color: '"+ cor_texto +"' },";
s += "                       grid: { display: false, color: '" + cor_grid + "'}";
s += "                  },";
s += "                  y: {";
s += "                       beginAtZero: "+ begin_Y_at_zero +",";
s += "                       ticks: { color: '"+ cor_texto +"' },";
s += "                       grid: { display: true, color: '" + cor_grid + "'}";
s += "                  }";
s += "        }";
s += "    };";

s += "    var ctx = document.getElementById('" + id_chart + "').getContext('2d');";
s += "    var myChart = new Chart(ctx, {";
s += "        type: 'bar',";
s += "        data: data,";
s += "        options: options";
s += "    });";
s += "</script>";
return s;

//DEBUG
//return createDataArray(readPoints(getDataPointIds(reading_points[0]).id), false).eixoX();


//FUNCOES DE APOIO
function obterTimestamps(ano) {
    // Crie os objetos Date para a hora de início e fim
    var output = new Date(ano, 0, 1, 0, 0, 0);

    // Retorne os timestamps
    return output.getTime();
}

function dataPointInfo(identifier) {
	var dpDAO = new com.serotonin.mango.db.dao.DataPointDao();
	var pvDAO = new com.serotonin.mango.db.dao.PointValueDao();
	var dpVO = dpDAO.getDataPoint(identifier);
	var sdf = new java.text.SimpleDateFormat("yyyy-MM-dd HH:mm:ss");

	var tipos = {
		0: "Desconhecido",
		1: "Binário",
		2: "Multiestados",
		3: "Numérico",
		4: "Alfanumérico",
		5: "Imagem"
	};

	// Propriedades do data point
	this.id = parseInt(dpVO.getId());
	this.xid = String(dpVO.getXid());
	this.nome = String(dpVO.getName());
	this.codigoTipo = parseInt(dpVO.getPointLocator().getDataTypeId());
	this.tipo = tipos[this.codigoTipo];
	this.setavel = String(dpVO.getPointLocator().isSettable()) == "true" ? true : false;

	// Converte objetos Java para Javascript
	this.formataValor = function(valor) {
		switch (this.codigoTipo) {
			case 1:
				return String(valor) == "true" ? true : false;
			break;

			case 3:
				return Number(valor);
			break;

			case 2:
			case 4:
				return String(valor);
			break;

			case 0:
			case 5:
				throw new "Erro: Tipo inválido";
			break;
		}
	};

	// Valor instantâneo (fachada)
	this.valorFacade = function() {
		var dpFacade = new com.serotonin.mango.rt.dataImage.PointValueFacade(this.id).getPointValue().value;
		var output_facade = parseFloat(dpFacade);
		return this.formataValor(output_facade);
	};

	// Último valor do data point
	this.valor = function() {
		return this.formataValor(pvDAO.getLatestPointValue(this.id).value);
	};
	this.ultimoValor = this.valor;

	// Último tempo do data point (humanamente legível)
	this.tempo = function() {
		return String(sdf.format(pvDAO.getLatestPointValue(this.id).time));
	};
	this.ultimoTempo = this.tempo;

	// Último tempo do data point (timestamp)
	this.tempoBruto = function() {
		return parseInt(pvDAO.getLatestPointValue(this.id).time)
	};
	this.ultimoTempoBruto = this.tempoBruto;

	// Últimos X valores do data point
	this.ultimosValores = function(maxValues) {
		var valoresJava = pvDAO.getLatestPointValues(this.id, maxValues);
		var valoresJS = new Array();
		for (var i = 0; i < valoresJava.size(); i++) {
			valoresJS.push(this.formataValor(valoresJava.get(i).value));
		}

		return valoresJS;
	};

	// Tempo das últimas X mudanças de valor do data point (humanamente legível)
	this.ultimosTempos = function(maxValues) {
		var temposJava = pvDAO.getLatestPointValues(this.id, maxValues);
		var temposJS = new Array();
		for (var i = 0; i < temposJava.size(); i++) {
			temposJS.push(String(sdf.format(temposJava.get(i).time)));
		}

		return temposJS;
	};

	// Tempo das últimas X mudanças de valor do data point (timestamp)
	this.ultimosTemposBrutos = function(maxValues) {
		var temposJava = pvDAO.getLatestPointValues(this.id, maxValues);
		var temposJS = new Array();
		for (var i = 0; i < temposJava.size(); i++) {
			temposJS.push(parseInt(temposJava.get(i).time));
		}

		return temposJS;
	};

	this.valoresEntre = function(startTime, endTime) {
		var valoresJava = pvDAO.getPointValuesBetween(this.id, startTime, endTime);
		var valoresJS = new Array();
		for (var i = 0; i < valoresJava.size(); i++) {
			valoresJS.push(this.formataValor(valoresJava.get(i).value));
		}

		return valoresJS.reverse();
	};

	this.temposEntre = function(startTime, endTime) {
		var temposJava = pvDAO.getPointValuesBetween(this.id, startTime, endTime);
		var temposJS = new Array();
		for (var i = 0; i < temposJava.size(); i++) {
			temposJS.push(String(sdf.format(temposJava.get(i).time)));
		}

		return temposJS.reverse();
	};

	this.temposBrutosEntre = function(startTime, endTime) {
		var temposJava = pvDAO.getPointValuesBetween(this.id, startTime, endTime);
		var temposJS = new Array();
		for (var i = 0; i < temposJava.size(); i++) {
			temposJS.push(parseInt(temposJava.get(i).time));
		}

		return temposJS.reverse();
	};

	this.valorEm = function(time) {
		var pointValue = pvDAO.getPointValueAt(this.id, time);
		if (!pointValue)
			pointValue = pvDAO.getPointValueBefore(this.id, time);

		return this.formataValor(pointValue.value);
	};
}


