Olá,estou utilizando o chart.js para aprensentar gráficos no ScadaBR, mas preciso colocar a legenda das variáveis na direita e limitar os valores desse gráfico de entre 0 e 100, mas não estou conseguindo fazer-los.
Já tentei atualizar o Chart.js para a versão mais recente (A versão que vem com ele é a 2.9.5 e a atual e a 4.2.0) Substituindo o arquivo local do chartjs para a mais recente.
Também coloquei o codigo para serguir o padrão que o chart js trabalha.
Segue o Código do chartjs:
{
type: ‘line’,
data: data,
options: {
responsive: true,
plugins: {
legend: {
position: ‘right’,
}
},
scales: {
y: {
min: 0,
max: 100
}
}
}
}
Esse é o padrão que tem que ser utlizado para ele gerar o gráfico do jeito que eu quero.
Fica Assim:
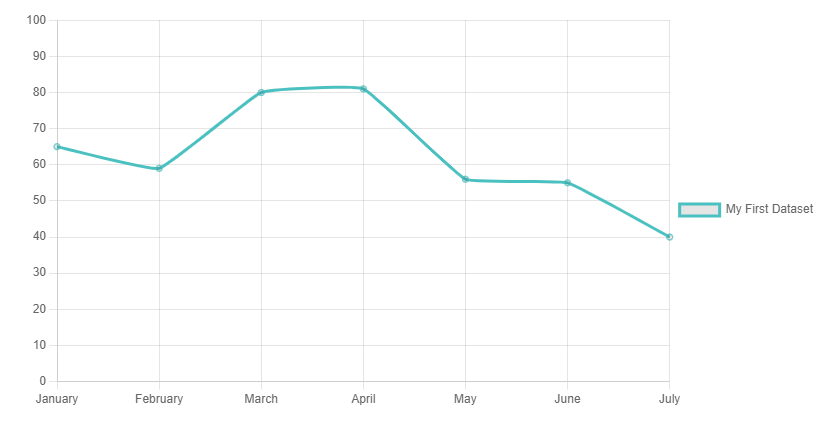
Isso foi feito direto em HTML.
E eu adaptei um pouco o server sideScript para conseguir fazer isso:
/* @license MIT */
// Points to be included in chart (ID or XID)
var reading_points = [ 1, 2 ];
// Color of each series in the graph
// (the position of each color corresponds
// to a point in “reading_array” variable)
var series_colors = [ ‘#FF9421ff’, ‘#000000ff’ ];
// Description of each series in the graph
// (each description corresponds to a point
// in “reading_array” variable)
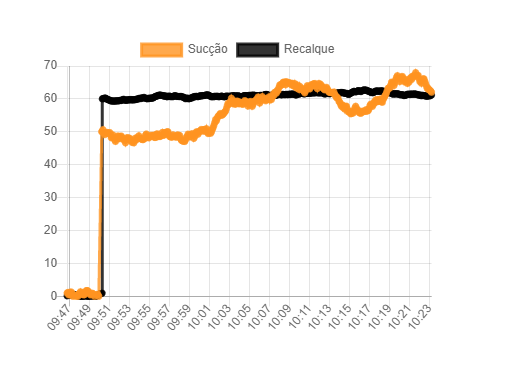
var descriptions = [ ‘Sucção’, ‘Recalque’ ];
// Time unit adopted in chart:
// 0 → Seconds
// 1 → Minutes
// 2 → Hours
// 3 → Dias
var time_unit = 3;
// Time period adopted in chart (in the unit
// specified by “time_unit” variable)
var time_value = 1;
// Customize chart size (in pixels)
var height = 300;
var width = 400;
// Configure chart title
var show_title = false;
var title = ‘’;
// Start Y-axis always at 0
var begin_Y_at_zero = true;
var max = 100;
var min = 0;
var enable_animations = true;
var enable_fill = false;
var tension = 0.3;
var borderwidth = 1;
//
// DON’T CHANGE THE CODE BELOW
//
var invalid_message = “is not a numeric, multistate or binary datapoint”;
var invalid_html = “”;
// Get datapoint identifiers (ID/XID)
function getDataPointIds(identifier) {
var dpDAO = new com.serotonin.mango.db.dao.DataPointDao();
var dp = dpDAO.getDataPoint(identifier);
var point_id = dp.getId();
var point_xid = String(dp.getXid());
return { id: point_id, xid: point_xid };
}
// Get data point type
function getDataPointType(identifier) {
var types = {
0: “UNKNOWN”,
1: “BINARY”,
2: “MULTISTATE”,
3: “NUMERIC”,
4: “ALPHANUMERIC”,
5: “IMAGE”
}
var dpDAO = new com.serotonin.mango.db.dao.DataPointDao();
var dp = dpDAO.getDataPoint(identifier);
var locator = dp.getPointLocator();
return types[locator.getDataTypeId()];
}
// Get data points’ values and times
function readPoints(id) {
// Units: Second, minute, hour
var unit_values = [ 1000, 60000, 360000, 8640000];
var index = time_unit;
var since = new Date().getTime() - (time_value * unit_values[index]);
var val = new com.serotonin.mango.db.dao.PointValueDao();
return val.getPointValues(id, since);
}
// Create a JSON array with a point value history
function createDataArray(obj, is_binary) {
var foo = ‘[’;
var size = obj.size() - 1;
for (var i = size; i >= 0; i--) {
	var time = obj.get(i).time;
	var value = obj.get(i).value;
	if (is_binary)
		value = String(value) == "true" ? 1 : 0;

	foo += '{"x":' + time + ',';
	foo += '"y":"' + value + '"}';

	if (i != 0) {
		foo += ',';
	}
}

foo += ']';
return foo;
}
// Create a JSON object compatible with Chart.js “datasets”
function createJSONDatasets() {
var size = reading_points.length;
var foo = ‘[’;
for (var i = 0; i < size; i++) {
	var is_binary = false;
	var dp_id = getDataPointIds(reading_points[i]).id;
	var dp_type = getDataPointType(dp_id);
	var point_values = readPoints(dp_id);

	// Don't include non numeric datapoints in array
	if (dp_type == "BINARY") {
		is_binary = true;
	} else if (dp_type != "NUMERIC" && dp_type != "MULTISTATE") {
		invalid_html += descriptions[i] + ": " + invalid_message + "<br>";
		continue;
	}

	if (foo != '[')
		foo += ',';

	var reading_array = createDataArray(point_values, is_binary);
	foo +=	'{';
	foo +=		'"label":"' + descriptions[i] + '",';
	foo +=		'"data":' + reading_array + ',';
	foo +=		'"fill":"' + enable_fill + '",';
	foo +=		'"backgroundColor":"' + series_colors[i] + '",';
	foo +=		'"borderColor":"' + series_colors[i] + '",';
    foo +=		'"tension":"' + tension + '",';
	foo +=		'"borderWidth":"' + borderwidth + '"';
	foo +=	'}';
}

foo += ']';
return foo;
}
//creating a variable that will recieve the datasets
var datasets = ‘{’
datasets += ‘“datasets”:’ + createJSONDatasets();
datasets += ‘},’;
// Create a JSON string that can be interpreted
// by FUScaBR library
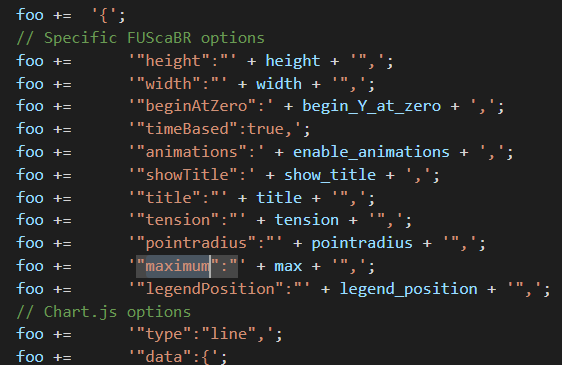
function createFinalJSON() {
var foo = ‘’;
foo +=	'{';
// Specific FUScaBR options
foo +=		'"height":"' + height + '",';
foo +=		'"width":"' + width + '",';
foo +=		'"beginAtZero":' + begin_Y_at_zero + ',';
foo +=		'"timeBased":true,';
foo +=		'"animations":' + enable_animations + ',';
foo +=		'"showTitle":' + show_title + ',';
foo +=		'"title":"' + title + '",';
// Chart.js options
foo +=		'"type":"line",';
foo +=		'"data":' + datasets;
foo +=		'"options":';
foo +=	        '{';
foo +=		    '"scales":';
foo +=	            '{';
foo +=		        '"y":';
foo +=	                '{';
foo +=		    '"suggestedMin":' + min + ',';
foo +=		    '"suggestedMax":' + max;
foo +=	                '}'
foo +=	            '},';
foo +=		        '"plugins":';
foo +=	                '{';
foo +=		            '"legend":';
foo +=	                    '{';
foo +=		                '"position":"right"';
foo +=	                    '}'
foo +=	                '}'
foo +=	        '}';
foo +=	'}';


return foo;
}
var s = “”;
if (invalid_html.length)
s += invalid_html;
/* Uncomment the line below to show the generated JSON code */
//s += “
return s;
Essa é a parte final onde ele está criando o Jason final.
Obs:
data, min, max são variaveis que fora declaradas acima.
Utilizando esse código eu coloquei rodar e ele gerou o gráfico certinho, mas sem o min e max e a legenda na direita.