Hello,
above all, I would like to say that the ScadaBR software is great and that I hope the team will continue to improve this fabulous software.
I’m sending you this message because I have questions about creating a “graphic view”.
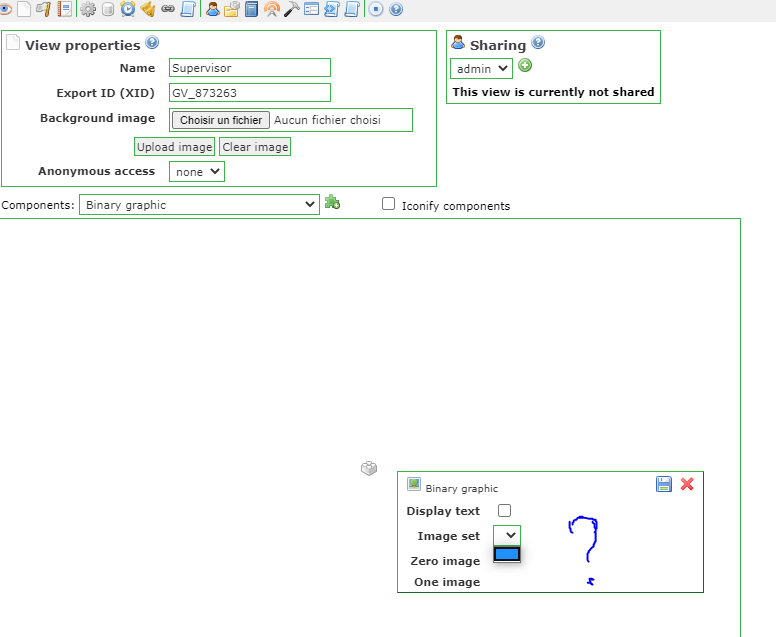
When I try to add a binary image to show the state of my led if it “on or off”, well I have nothing !!!
In addition, second question: I have notions in web development, can I program the graphic view in html, css and javascript?
third question: how do we determine Offset (0-based)? I know that it is in relation to the data of the modbus but I have trouble understanding how to calculate or determine it.
For the PLC system, I use OPENPLC. And for scada, I installed a virtual machine under ubuntu 20.04 LTS which I adapted.
Here is the procedure that inspired me:
[ScadaBR Install Guide for a fresh install of Ubuntu 64bit server (headless) version 16.04.3 using mariadb(mysql) as the database // Also Works on Raspberry Pi 3]
Pending your answers,
Sincerely and friendly,
Hello Dear Kooroshtux,
first, you need to create some DataPoints to “link” with your binary graphic…
you can use the component HTML to program your graphic view and use html, css and javascript… other way is to make an script html/css/javascript in notepad and paste it on the directory of scadabr
WebApps/ScadaBR/resources
i’m not a programmer but i think it will help you
and for the third question, you can determine your Offset by your PLC, in my case i use ModBus TCP/IP so i have to transfer my PLC data by the modbus and acquire it on the datasource Modbus TCP… if you are using a binary on PLC you need to choose the coil status and your offset 0 is your 1 on PLC, if you are using an INT you need to choose the holding register…
let me know if it helped you